Multiple Choice
Here is a stacked bar chart for data collected about employee blood pressure. 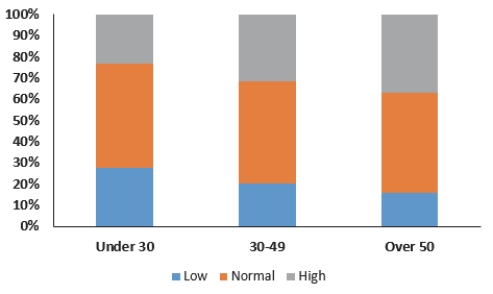 This chart shows
A) the distribution of a quantitative variable.
B) the contingency distribution of blood pressure type.
C) the conditional distribution of blood pressure type.
D) the marginal distribution of blood pressure type.
E) the joint distribution of blood pressure type.
Correct Answer:

Verified
Correct Answer:
Verified
Q16: Consider the following to answer the question(s)
Q22: Consider the following to answer the question(s)
Q23: A research company frequently monitors trends
Q35: A regional survey was carried out to
Q37: Accenture, a consulting firm, conducted an
Q38: Accenture, a consulting firm, conducted an online
Q39: A large national retailer of electronics
Q40: A company interested in the health of
Q43: A restaurant uses comment cards to
Q44: Find each of the following percentages. a.