Essay
Consider the following side by side bar chart for the data above: 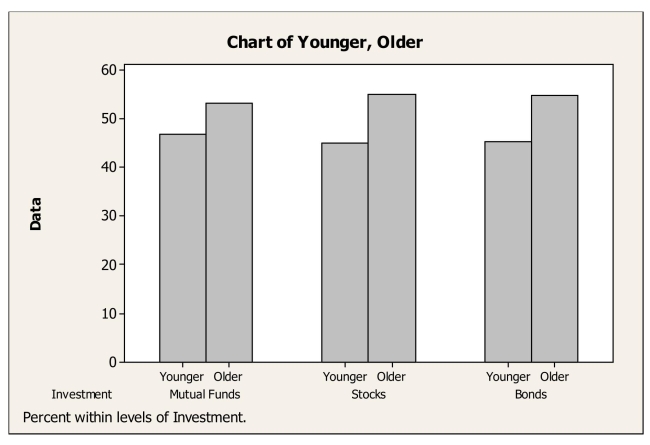 Does the chart indicate that mode of investment is independent of age? Explain.
Correct Answer:

Verified
Correct Answer:
Verified
Related Questions
Q1: A full service brokerage firm gathered information
Q4: A large national retailer of electronics conducted
Q5: Find each of the following percentages.<br>a.What percent
Q6: Consider the following to answer the question(s)
Q7: A regional survey was carried out to
Q8: Interpret summary statistics.<br>-Find each of the following
Q9: A restaurant uses comment cards to get
Q11: A regional survey was carried out to
Q23: A research company frequently monitors trends
Q23: A research company frequently monitors trends