Multiple Choice
Based on the graph below, how can we best describe the shape of this distribution? 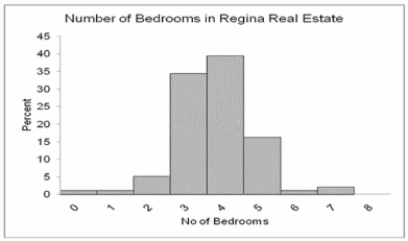
A) Relatively symmetrical
B) Positively skewed
C) Negatively skewed
D) No variation
E) Bimodal
Correct Answer:

Verified
Correct Answer:
Verified
Related Questions
Q16: A disadvantage of using an arithmetic mean
Q165: The U.S. Department of Education reported that
Q191: If a major sports star were to
Q192: Determine the age of the oldest person
Q193: (i. A small manufacturing company with 52
Q194: (i. If the mean of a frequency
Q195: (i. The range for laminate flooring is
Q198: (i. The median for the distribution of
Q199: (i. The research director of a large
Q201: (i. The median (measure of central tendency)