Multiple Choice
Based on the graph below, how can we best describe the shape of this distribution? 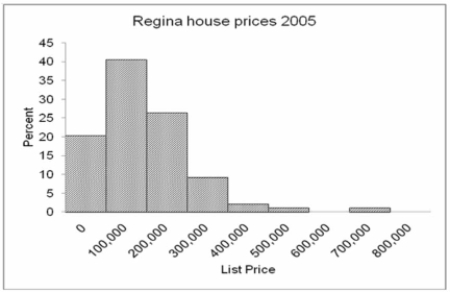
A) Relatively symmetrical
B) Positively skewed
C) Negatively skewed
D) No variation
E) Bimodal
Correct Answer:

Verified
Correct Answer:
Verified
Related Questions
Q35: The weights (in kilograms) of a group
Q35: What do the quartile deviation and the
Q62: A population consists of all the weights
Q64: (i. The range for laminate flooring is
Q65: Listed below is the box plot of
Q67: The means differ vastly. The annual incomes
Q68: What disadvantage(s) are there of the mean
Q69: (i. If two sets of data are
Q70: The coefficient of variation generally lies between
Q94: What is the relationship between the variance