Multiple Choice
Listed below is the box plot of average earnings ratio for full-year, full-time female workers from
1999 to 2008. 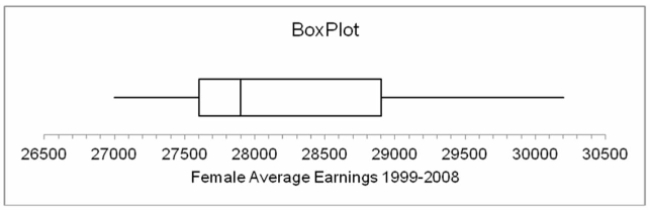
From this we can interpret that the distribution of average earnings for women for the years 1999-
2008 was:
A) Symmetrical
B) Positively skewed
C) Negatively skewed
D) Bimodal
E) Variable
Correct Answer:

Verified
Correct Answer:
Verified
Related Questions
Q108: (i. Based on the values of the
Q109: The lengths of stay on the cancer
Q110: i. The interquartile range is the average
Q111: AAA Heating and Air Conditioning completed 30
Q112: (i. The arithmetic mean (measure of central
Q114: The weights (in grams) of the contents
Q115: (i. If two sets of data are
Q116: (i. If two sets of data are
Q117: The ages of a sample of telephones
Q118: Referring to the histogram below, choose the