Multiple Choice
The information below shows the summary statistics of data adapted from Statistics Canada,
Regarding gasoline prices from urban cities across Canada. 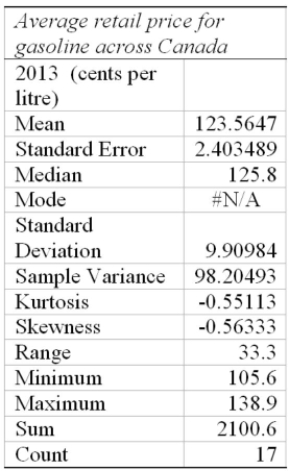
(i. This data is based on values from 17 cities.
(ii. The average gas price in 2013 across the country based on this sample was $1.2356
(iii) 50% of the cities reported average gas prices over $1.23 per litre
A) (i) , (ii) and (iii) are all correct statements
B) (i) and (ii) are correct statements but not (iii) .
C) (i) and (iii) are correct statements but not (ii) .
D) (ii) and (iii) are correct statements, but not (i) .
E) (i) , (ii) and (iii) are all false statements.
Correct Answer:

Verified
Correct Answer:
Verified
Q69: A disadvantage of using an arithmetic mean
Q74: (i. Based on the values of the
Q75: Listed below is the box plot of
Q76: The Federal Aviation Administration reported that passenger
Q77: Listed below is the average earnings ratio
Q79: i. The sum of the deviations from
Q80: A sample of the daily number of
Q81: The printout below is a summary of
Q82: (i. If a distribution is highly skewed,
Q83: (i. The range for laminate flooring is