Multiple Choice
Statistics Canada report 2010 results in the following chart. 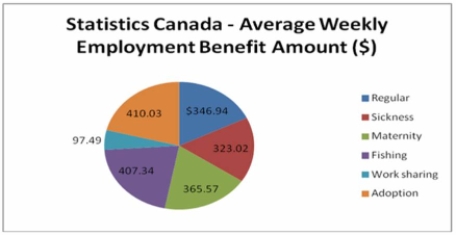 Is the data quantitative or qualitative? What is the name of the table shown?
A) quantitative, simple table
B) quantitative, pie chart
C) qualitative, frequency table
D) qualitative, pie chart
E) quantitative, bar chart
Correct Answer:

Verified
Correct Answer:
Verified
Related Questions
Q5: A student was interested in the cigarette
Q6: How many firms export less than $14
Q8: What is the class interval for the
Q8: One rule that must always be followed
Q10: Refer to the following price of jeans
Q11: Given the following stem and leaf plot,
Q12: For the distribution of ages above, what
Q13: The following ages (rounded to the nearest
Q14: The following ages (rounded to the nearest
Q45: (i. Bar charts are useful for showing