Multiple Choice
Listed below is the net sales in $ million for Home Depot Inc., and its subsidiaries from 1994 to
2003. 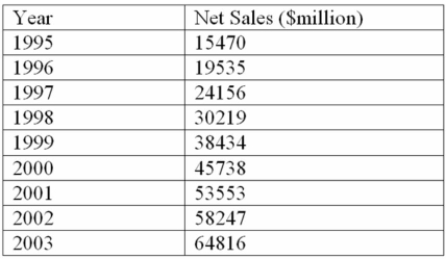
Using the printout below, what are the estimated sales for 2004? 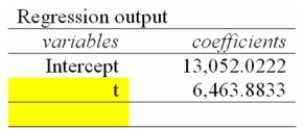
A) $90,618.6 Million
B) $77,690.9 Million
C) $84,154.7 Million
D) $103,546.4 Million
E) $71,227.0 Million
Correct Answer:

Verified
Correct Answer:
Verified
Related Questions
Q139: i. A time series is a collection
Q140: Given the payoff table below, determine the
Q141: i. In the linear trend equation, t
Q142: The following table lists the average price
Q143: The merchants in Morris, Manitoba suffered flood
Q145: i. The moving average method merely smooths
Q146: If the least squares equation for sales
Q147: i. If the sales, production or other
Q148: How can you describe the moving average
Q149: If you have annual data for 1991