Multiple Choice
Listed below is the net sales in $ million for Home Depot Inc., and its subsidiaries from 1994 to
2003. 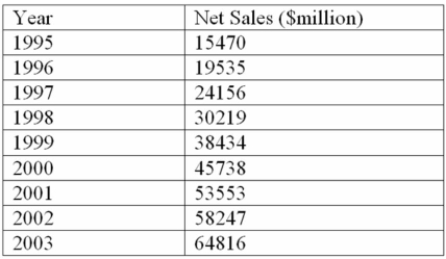
Using the printout below, what are the estimated sales for 2005? 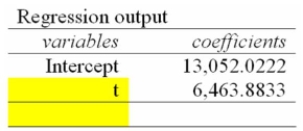
A) $90,618.6 Million
B) $77,690.9 Million
C) $84,154.7 Million
D) $103,546.4 Million
E) $71,227.0 Million
Correct Answer:

Verified
Correct Answer:
Verified
Q26: The following linear trend equation was developed
Q126: i. Long-term forecasts are usually from one
Q127: A linear trend equation is used to
Q128: You are trying to decide in which
Q130: The alternative which offers the lowest EOL
Q132: You are trying to decide in which
Q133: If the data appears to be increasing
Q134: For a time series beginning with 1988
Q135: Consider the following decision table in which
Q136: i. The ratio-to-moving average method removes the