Multiple Choice
Listed below is the net sales in $ million for Home Depot Inc., and its subsidiaries from 1994 to
2003. 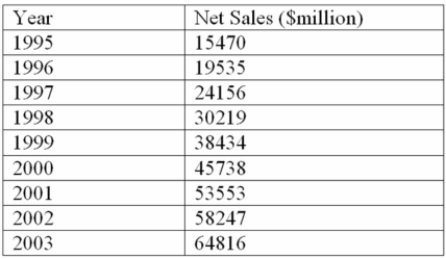
Using the printout below, what are the estimated sales for 2006? 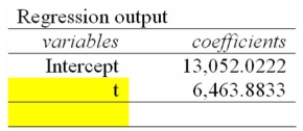
A) $90,618.6 Million
B) $477,690.9 Million
C) $84,154.7 Million
D) $103,546.4 Million
E) $71,227.0 Million
Correct Answer:

Verified
Correct Answer:
Verified
Related Questions
Q3: Which one of the following is not
Q16: i. The irregular component of a time
Q17: What is variation within a year, such
Q18: You are trying to decide in which
Q19: An investor has a 35% chance of
Q20: You are trying to decide in which
Q22: Why are long range predictions considered essential
Q23: You are trying to decide in which
Q24: Given a linear time series trend, <img
Q25: A plastics manufacturing performed a quarterly time