Multiple Choice
Listed below is the net sales in $ million for Home Depot Inc., and its subsidiaries from 1994 to
2003. 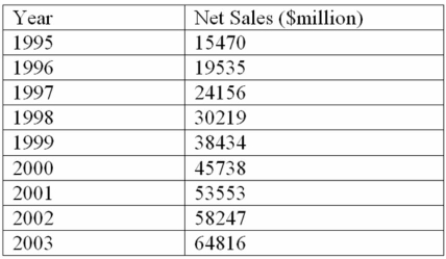
Using the printout below, what are the estimated sales for 2007? 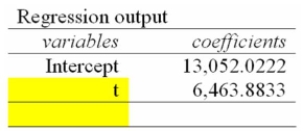
A) $90,618.6 Million
B) $477,690.9 Million
C) $84,154.7 Million
D) $103,546.4 Million
E) $71,227.0 Million
Correct Answer:

Verified
Correct Answer:
Verified
Q71: Given the following decision table in which
Q72: Consider the following decision table in which
Q73: Given the following decision table in which
Q74: i. Many business and economic time series
Q75: You are trying to decide in which
Q77: i. The moving average method averages out
Q78: You are trying to decide in which
Q79: If the data appears to be increasing
Q80: Determine the expected profit for the following
Q81: What time series component was exemplified during