Multiple Choice
Listed below is the net sales in $ million for Home Depot Inc., and its subsidiaries from 1994 to
2003. 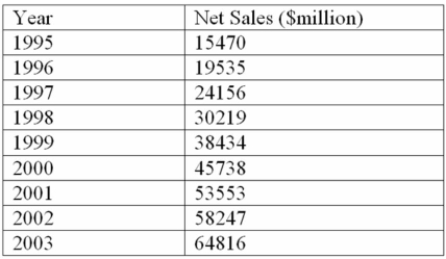
Using the printout below, what are the estimated sales for 2009? 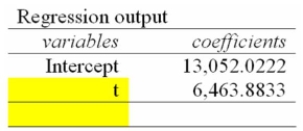
A) $90,618.6 Million
B) $97,082.5 Million
C) $84,154.7 Million
D) $103,546.4 Million
E) $71,227.0 Million
Correct Answer:

Verified
Correct Answer:
Verified
Related Questions
Q42: You have a decision to invest $10,000
Q43: i. In the ratio-to-moving-average procedure, using the
Q44: i. A typical monthly seasonal index of
Q45: Consider the following decision table in which
Q46: The following table lists the average price
Q47: A payoff table is needed to:<br>A) control
Q48: i. In the linear trend equation, the
Q49: i. In the final step, using the
Q50: You are trying to decide in which
Q52: You are trying to decide in which