Multiple Choice
The table below shows the sales for a plastics manufacturer recorded over the past year. The
Seasonal indexes for each quarter are also provided. To track the trend for these four quarters, use
The indexes to deseasonalize the sales data. 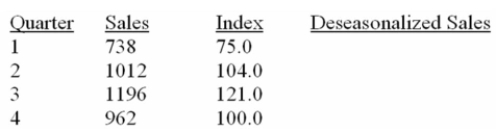
What are deseasonalized sales for quarter 1?
A) 553.5
B) 984.0
C) 1291.5
D) 184.5
E) 922.5
Correct Answer:

Verified
Correct Answer:
Verified
Q3: Which one of the following is not
Q22: Why are long range predictions considered essential
Q23: You are trying to decide in which
Q24: Given a linear time series trend, <img
Q25: A plastics manufacturing performed a quarterly time
Q28: Determine the expected opportunity loss for the
Q29: You have a decision to invest $10,000
Q30: Below is the payoff table for two
Q31: i. Using the ratio-to-moving-average method, dividing the
Q32: The table below shows the sales for