Multiple Choice
The following graph is used to evaluate an assumption of a multiple regression analysis. What is the
Assumption? 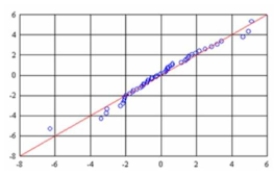
A) Normal distribution of residuals
B) Linearity
C) Homoscedasticity
D) Scatter diagram
Correct Answer:

Verified
Correct Answer:
Verified
Related Questions
Q107: The information below is from the multiple
Q108: The following correlations were computed as part
Q109: A sample of General Mills employees was
Q110: i. The multiple coefficient of determination, R2,
Q111: i. The multiple standard error of estimate
Q113: It has been hypothesized that overall academic
Q114: A sample of General Mills employees was
Q115: Twenty-one executives in a large corporation were
Q116: i. The multiple coefficient of determination, R2,
Q117: The following correlations were computed as part