Multiple Choice
Given the scatter diagram below, that shows the number of workdays absent per year based on the
Age of the employees, which of the following statements are true? 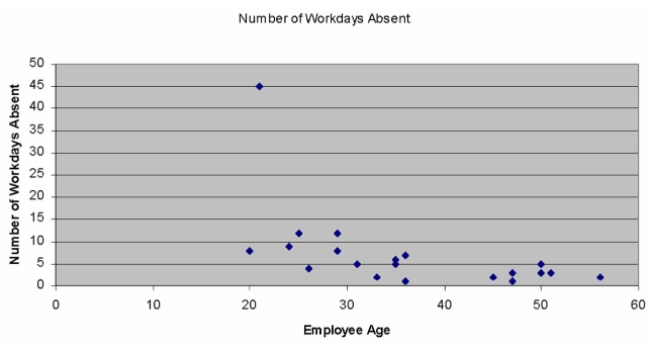
A) There is clearly no relationship whatsoever between an employee's age and the number of workday absences that they take.
B) There is a single but strong outlier in this data set.
C) In analyzing this data, you may wish to remove the one point that doesn't "fit" with all the others before continuing your analysis.
D) There is clearly no relationship whatsoever between an employee's age and the number of workday absences that they take, however, there is a single but strong outlier in this
Data set.
E) There is a single but strong outlier in this data set; in analyzing this data, you may wish to remove the one point that doesn't "fit" with all the others before continuing your analysis.
Correct Answer:

Verified
Correct Answer:
Verified
Q97: Information was collected from employee records to
Q98: i. A t test is used to
Q99: i. A coefficient of correlation r close
Q100: What is the range of values for
Q101: The correlation between two variables is -0.63
Q103: Data is collected from 20 sales people
Q104: i. The strength of the correlation between
Q105: i. The purpose of correlation analysis is
Q106: i. The technique used to measure the
Q107: i. The coefficient of determination is the