Multiple Choice
Use the scatter diagrams to verify which statements are correct:
Chart A 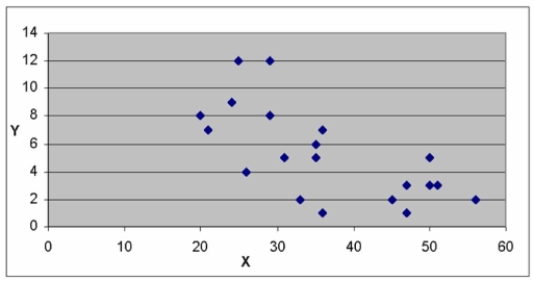
Chart B 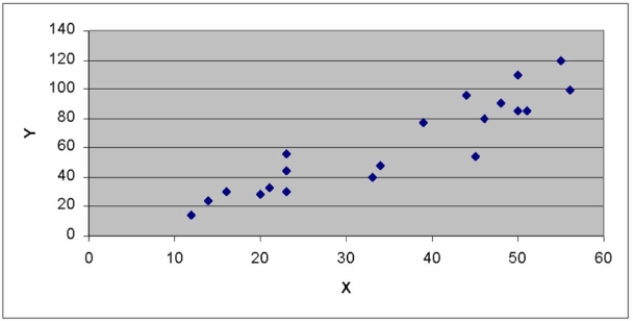
Chart C 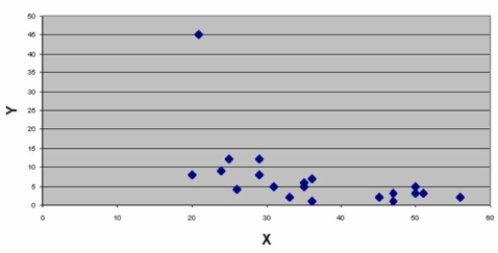
A) The variables in Chart A have a positive correlation.
B) Multiple Choice Difficulty: Medium Learning
C) The variables in Chart B have a positive correlation.
D) The variables in Chart B have a negative correlation.
E) The variables in Chart A have a stronger correlation than the variables in Chart B
Correct Answer:

Verified
Correct Answer:
Verified
Q49: Which value of r indicates a stronger
Q82: Which value of r indicates a stronger
Q160: A sales manager for an advertising agency
Q161: The correlation between two variables is -0.63
Q163: i. In order to visualize the form
Q164: The relationship between interest rates as a
Q166: Data is collected from 20 sales people
Q168: A sales manager for an advertising agency
Q169: Information was collected from employee records to
Q170: The partial MegaStat output below is regression