Multiple Choice
Data is collected from 20 sales people in order to verify that the more contacts made with potential
Clients, the greater the sales volume. The MegaStat printout is shown below. 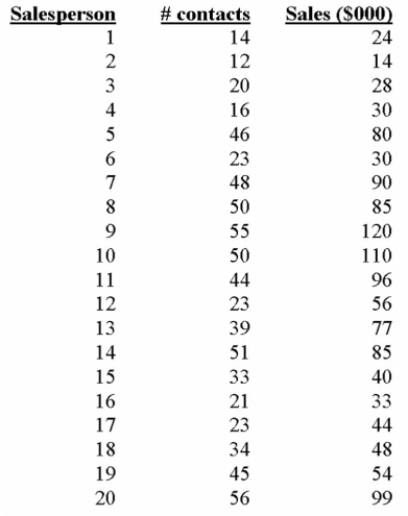
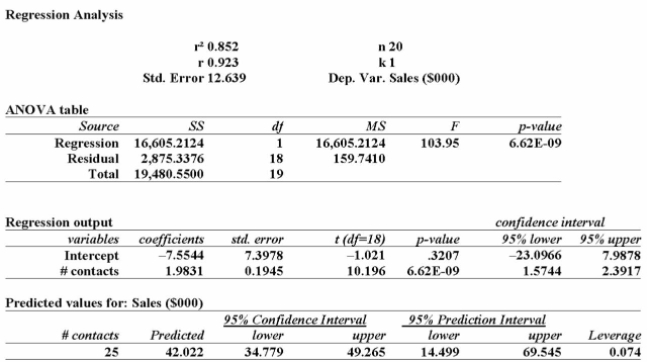
Analyzing this printout we can determine:
A) the value of t indicates that the coefficient of correlation is greater than zero when using the 0.05 level of significance.
B) the value of t indicates that the coefficient of correlation is greater than zero when using the 0.01 level of significance.
C) the p-value indicates that the coefficient of correlation is greater than zero when tested at the 0.01 level of significance.
D) for each extra contact made, sales can be anticipated at approximately $1,113.
E) the value of t indicates that the coefficient of correlation is greater than zero at both the 0.05 and 0.01 levels of significance. The p-value indicates that the coefficient of correlation
Correct Answer:

Verified
Correct Answer:
Verified
Q1: A scatter diagram is a chart,<br>A) in
Q130: The regression equation is: <img src="https://d2lvgg3v3hfg70.cloudfront.net/TB1024/.jpg" alt="The
Q131: i. The purpose of correlation analysis is
Q132: i. Correlation analysis is a group of
Q133: We have collected price per share and
Q134: Data is collected from 20 sales people
Q136: Using a 95% significance level, what is
Q137: Given the following five points: (-2,0), (-1,0),
Q138: i. In order to visualize the form
Q140: i. If we are studying the relationship