Multiple Choice
Using the Excel printout below to compare the mean annual incomes for executives with
Undergraduate and Master's Degree or more, the following statements can be made: 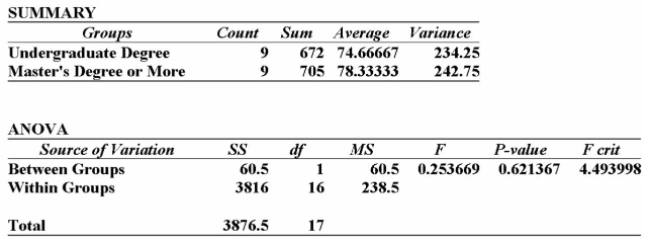
A) since the calculated F-value is smaller than the F-critical value, there is no significant difference in the incomes of these two groups.
B) since the calculated F-value is smaller than the F-critical value, there is a significant difference in the incomes of these two groups.
C) since the P-value is 0.62, there is a 62% chance of these results happening when there is no significant difference in the incomes of these two groups.
D) since the calculated F-value is larger than the F-critical value, and the P-value is so small, there is strong evidence to suggest that both groups with different levels of education
Have the same incomes.
E) since the calculated F-value is smaller than the F-critical value, there is no significant difference in the incomes of these two groups; also, since the P-value is 0.62, there is a
Correct Answer:

Verified
Correct Answer:
Verified
Q8: Which of the following is NOT a
Q30: i. The F distribution is positively skewed
Q31: The plant manager believes that the temperature
Q32: Suppose that an automobile manufacturer designed a
Q36: Given the following Analysis of Variance table
Q37: i. If we want to determine which
Q38: Suppose that an automobile manufacturer designed a
Q39: Two accounting professors decided to compare the
Q40: The annual dividend rates for a random
Q47: The components of an ANOVA table include:<br>A)