Multiple Choice
A random sample of 30 executives from companies with assets over $1 million was selected and
Asked for their annual income and level of education. The ANOVA comparing the average income
Among three levels of education rejected the null hypothesis. The Mean Square Error (MSE) was
243) 7. The following table summarized the results: 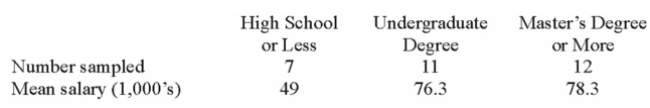
When comparing the mean salaries to test for differences between treatment means, the t statistic
Is based on:
A) the treatment degrees of freedom.
B) the total degrees of freedom.
C) the error degrees of freedom.
D) the ratio of treatment and error degrees of freedom.
Correct Answer:

Verified
Correct Answer:
Verified
Q1: A manufacturer of automobile transmissions uses three
Q2: A random sample of 30 executives from
Q3: i. If the computed value of F
Q4: A manufacturer of automobile transmissions uses three
Q6: i. The statistical technique used to test
Q7: Two accounting professors decided to compare the
Q8: i. The F distribution is positively skewed
Q9: Several employees have submitted different methods of
Q10: i. For the population means, the alternate
Q11: Two accounting professors decided to compare the