Multiple Choice
In the following graph, S and D represent the supply and demand curves, respectively, in the labour market. Refer to the graph to answer the question. 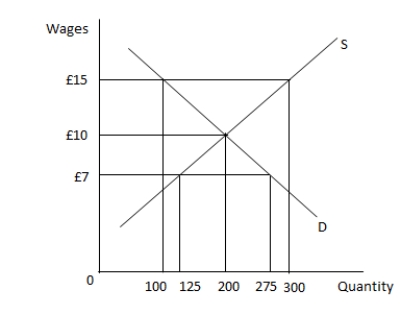 The labour market is in equilibrium when _____ workers are employed.
A) 200
B) 100
C) 300
D) 275
Correct Answer:

Verified
Correct Answer:
Verified
Related Questions
Q74: If the nominal rate of interest is
Q75: The output method of measuring GDP is
Q76: A policy implication of the downward-sloping Phillips
Q77: The unemployment that resulted when the typewriter
Q78: How do governments manage the economy by
Q80: Which of the following statements is correct?<br>A)
Q81: What are the different types of unemployment?
Q82: Other things unchanged, which of the following
Q83: During periods of rising inflation, there is
Q84: In the UK, the _ measures the