Multiple Choice
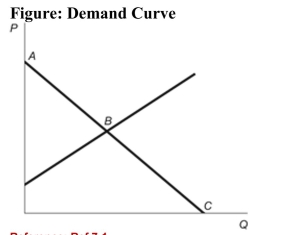 Reference: Ref 7-1 (Figure: Demand Curve) Refer to the figure. Which point on the graph represents the value of the good in its next highest valued use?
A) Point A
B) Point B
C) Point C
D) the origin
Correct Answer:

Verified
Correct Answer:
Verified
Related Questions
Q25: Suppose that it is summer 2012 and
Q26: Which of the following scenarios would cause
Q27: Suppose that war in the Middle East
Q34: It is Valentine's Day in the United
Q47: Recall from the text that weather is
Q59: Suppose speculators expect that the supply of
Q184: If speculators expect that the future price
Q220: The market is effectively able to allocate
Q227: Speculators who think that a war in
Q267: What happens in one particular market may