Multiple Choice
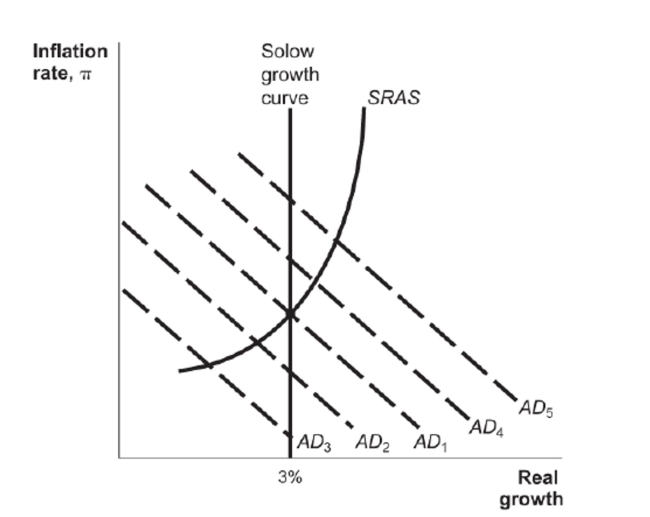
Figure: Monetary Policy and Demand Shocks  Reference: Ref 16-2 (Figure: Monetary Policy and Demand Shocks) The original real growth rate of the economy was 3 percent when a negative aggregate demand shock caused a shift of the AD curve from AD1 to AD2. As a result of the Fed's policy response, the AD curve shifted to AD5 in the short run. Which of the following is TRUE about the Fed's policy response?
A) The Fed responded too little to the shock.
B) The Fed responded too much to the shock.
C) The Fed provided just the right amount of response to the shock.
D) The Fed was too fast in responding to the shock.
Correct Answer:

Verified
Correct Answer:
Verified
Q22: The Fed dealt with high inflation in
Q36: Bringing inflation down is more difficult than
Q51: What was Milton Friedman's reasoning behind the
Q52: In the short run, if the Fed
Q56: A potential problem with expansionary monetary policy
Q58: The bandwagon effect causes investment to be:<br>A)
Q67: Deflation has occurred if the economy's price
Q142: After September 11,2001,the Fed resisted the temptation
Q166: The housing boom of the 2000s caused
Q216: Monetary policy is more effective in changing