Multiple Choice
(Figure: Demand Shift) Which of the following could explain the figure? 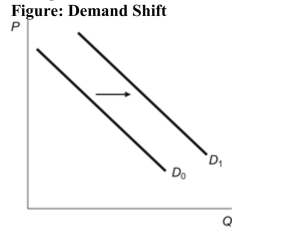
A) Consumer income increases in the market for a normal good.
B) Consumer income falls in the market for a normal good.
C) Consumer income rises in the market for an inferior good.
D) Consumer income falls in the market for a luxury good.
Correct Answer:

Verified
Correct Answer:
Verified
Q82: What does the law of supply state?<br>A)
Q103: (Figure: Demand Curve) Refer to the figure.
Q104: A market has a supply equation as
Q106: (Figure: Consumer Surplus) Refer to the figure.
Q109: (Figure: Demand Curve) Which of the following
Q110: (Table: Excel Company) The table shows the
Q111: <img src="https://d2lvgg3v3hfg70.cloudfront.net/TB3375/.jpg" alt=" Reference: Ref 3-4
Q142: Advances in technology such as personal computers
Q180: If the university president valued a parking
Q185: An increase in the population will lead