Multiple Choice
Figure: Supply Shifts 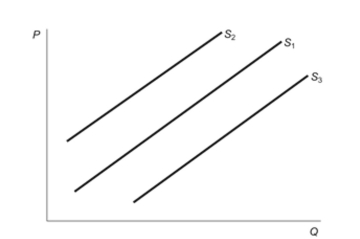 Reference: Ref 3-4 (Figure: Supply Shifts) In the figure, the initial supply curve is S1. Producers engage in market speculation with the belief that the price of the good will increase in the near future. This would be represented in the figure by shifting the:
A) supply curve to S2, resulting in a lower quantity supplied at each price.
B) supply curve to S2, resulting in a higher quantity supplied at each price.
C) supply curve to S3, resulting in a lower quantity supplied at each price.
D) supply curve to S3, resulting in a higher quantity supplied at each price.
Correct Answer:

Verified
Correct Answer:
Verified
Q2: What does the law of demand state?<br>A)
Q4: In the oil market, an increase in
Q7: Figure: Producer Surplus <img src="https://d2lvgg3v3hfg70.cloudfront.net/TB3375/.jpg" alt="Figure: Producer
Q9: The price of coffee has increased, yet
Q10: (Figure A: Supply Right Shift) (Figure B:
Q48: A tax of $4 shifts the supply
Q90: A change in price is reflected by
Q182: The quantity demanded of a good or
Q234: Which of the following would cause the
Q243: Which one of the following choices would