Multiple Choice
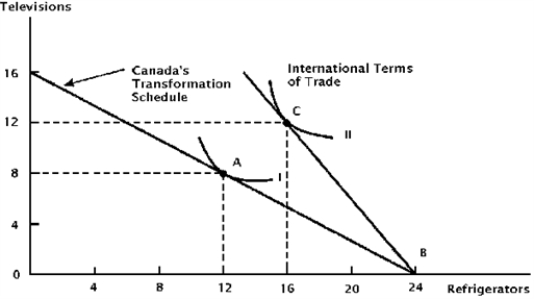
Figure 2.2 illustrates trade data for Canada.The figure assumes that Canada attains international trade equilibrium at point C.
Figure 2.2.Canadian Trade Possibilities
-Concerning possible determinants of international trade,which are sources of comparative advantage? Differences in:
A) Methods of production
B) Tastes and preferences
C) Technological know-how
D) All of the above
Correct Answer:

Verified
Correct Answer:
Verified
Q196: The theory of reciprocal demand does not
Q197: Adam Smith<br>A) Was a leading advocate of
Q198: If a production possibilities curve is bowed
Q199: Suppose that a country's post-trade consumption point
Q200: The Ricardian theory of comparative advantage assumes
Q202: Table 2.2.Output possibilities for South Korea and
Q204: When a nation requires fewer resources than
Q205: The price-specie-flow mechanism illustrated why nations could
Q205: David Ricardo's simplified trade model assumes all
Q206: The earliest statement of the principle of