Multiple Choice
Figure 7.5 Global Market for Tin
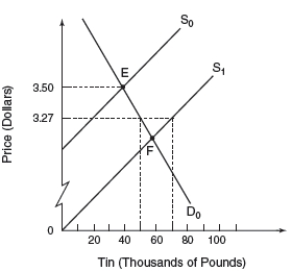
-Figure 7.5 represents the global market for tin.The initial equilibrium price and quantity is at point A.As a result of an International Tin Agreement a price range of $3.27 - $4.02 is set.As the supply of tin increases from S0 to S1,the buffer-stock manager will need to
A) buy 10,000 pounds of tin
B) buy 20,000 pounds of tin
C) sell 10,000 pounds of tin
D) sell 20,000 pounds of tin
Correct Answer:

Verified
Correct Answer:
Verified
Q14: Which nation accounts for the largest amount
Q16: Figure 8.1 depicts the supply and demand
Q35: Relative to a regional trade agreement, a
Q65: The formation of a regional trading bloc
Q68: A factor that discourages economic growth in
Q114: The United States serves as an example
Q135: Along the "ladder of economic development," Canada
Q190: The theory of optimal currency areas concludes
Q194: Comparing per-capita incomes of many developing countries
Q197: A cartel tends to be most successful