Multiple Choice
The figure below illustrates the supply and demand schedules of Swiss francs in a market of freely-floating exchange rates.
Figure 12.1 The Market for Francs
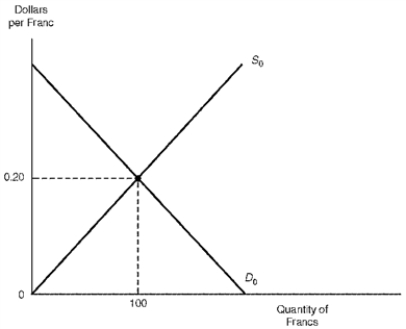
-Refer to Figure 12.1.Should real interest rates in the United States rise relative to real interest rates in Switzerland,there would occur a (an) :
A) Increase in the demand for francs--decrease in the supply of francs-depreciation of the dollar
B) Increase in the demand for francs--decrease in the supply of francs-appreciation of the dollar
C) Decrease in the demand for francs--increase in the supply of francs-appreciation of the dollar
D) Decrease in the demand for francs--decrease in the supply of francs-depreciation of the dollar
Correct Answer:

Verified
Correct Answer:
Verified
Q85: In the long run, exchange rates are
Q120: Concerning exchange rate forecasting,_ relies on econometric
Q122: The figure below illustrates the supply and
Q123: In the long run,exchange rates are primarily
Q127: If the exchange rate between Swiss francs
Q128: All of the following are important long-run
Q129: The figure below illustrates the supply and
Q130: Use the following table to answer the
Q133: If the U.S.interest rate rises relative to
Q150: What is exchange rate overshooting?