Multiple Choice
The figure below illustrates the supply and demand schedules of Swiss francs in a market of freely-floating exchange rates.
Figure 12.1 The Market for Francs
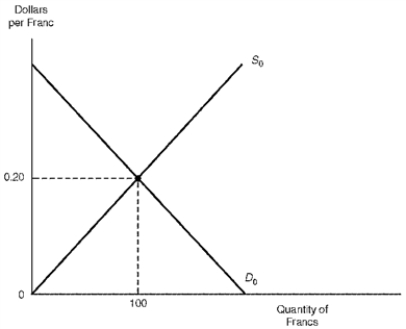
-Refer to Figure 12.1.If Switzerland experienced a disastrous wheat-crop failure,leading to additional wheat imports from the United States,there would occur an:
A) Increase in the supply of francs and an appreciation of the dollar
B) Increase in the supply of francs and a depreciation of the dollar
C) Increase in the demand for francs and a depreciation of the dollar
D) Increase in the demand for francs and an appreciation of the dollar
Correct Answer:

Verified
Correct Answer:
Verified
Q42: A forward premium on the British pound
Q63: If you were considering hiring a forecasting
Q64: A decrease in the U.S.demand for automobile
Q65: If investors anticipate that the exchange value
Q67: Given a floating exchange rate system an
Q69: If the rate of growth in labor
Q70: That identical goods should cost the same
Q71: Due to increased air travel,suppose that Saudi
Q72: The international exchange value of the U.S.dollar
Q83: Day-to-day influences on foreign exchange rates always