Multiple Choice
Figure 12.3Market for British Pounds
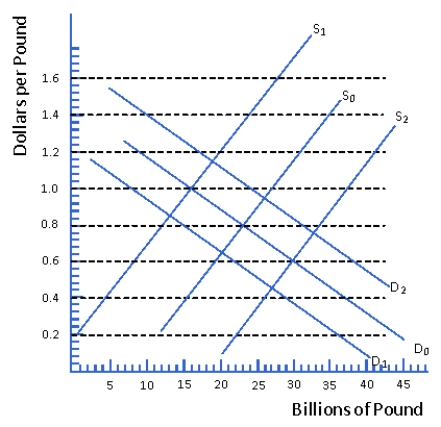
-Consider Figure 12.3.The market is initially governed by demand curve D0 and supply curve S0.Suppose US consumers develop stronger preferences for UK made goods,which supply and demand curves depict the new situation?
A) S1 and D2
B) S2 and D1
C) S0 and D2
D) S0 and D1
Correct Answer:

Verified
Correct Answer:
Verified
Q7: Which example of market expectations causes the
Q8: The figure below illustrates the supply and
Q9: For an American investor,the expected rate of
Q11: Under a system of floating exchange rates,relatively
Q14: With floating exchange rates,relatively high productivity growth
Q16: A shift in the U.S.supply curve of
Q22: The supply curve of dollars decreases (shifts
Q55: If the U.S.inflation rate rises to the
Q126: In a free market, what determines exchange
Q190: If the interest rate in Japan increases,