Multiple Choice
The following graph shows the volume of wood produced in a single-species forest. Here f (t) is measured in cubic meters/hectare and t is measured in years. By computing the slopes of the respective tangent lines, estimate the rate at which the wood grown is changing at the beginning of year 10 and at the beginning of year 40. 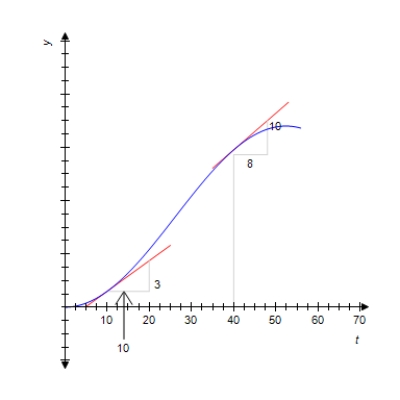
A)  cubic meters/hectare per year in the year 10,
  cubic meters/hectare per year in the year 40
B)  cubic meters/hectare per year in the year 10,
  cubic meters/hectare per year in the year 40
C)  cubic meters/hectare per year in the year 10,
  cubic meters/hectare per year in the year 40
D)  cubic meters/hectare per year in the year 10,
  cubic meters/hectare per year in the year 40
Correct Answer:

Verified
Correct Answer:
Verified
Q104: The circumference of a circle is given
Q105: Find the indicated limit, if it exists.
Q106: Ace Truck leases its 10-ft box truck
Q107: Find the limit, if it exists. Otherwise,
Q108: Use the graph of the function f
Q110: Find the limit, if it exists.
Q111: Use the four-step process to find the
Q112: Find the limit.<br> <img src="https://d2lvgg3v3hfg70.cloudfront.net/TB8255/.jpg" alt="Find the
Q113: Find the indicated limit, if it exists.
Q114: Let <img src="https://d2lvgg3v3hfg70.cloudfront.net/TB8255/.jpg" alt="Let ,