Short Answer
In the following figure, f(t) gives the population P1 of a certain bacteria culture at time t after a portion of bactericide A was introduced into the population at t = 0. The graph of g gives the population P2 of a similar bacteria culture at time t after a portion of bactericide B was introduced into the population at t = 0.
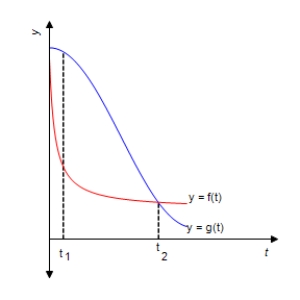
Which population is decreasing faster at t1?
Population __________
Which population is decreasing faster at t2?
Population __________
Which bactericide is more effective in reducing the population of bacteria in the short run?
Bactericide __________
Which bactericide is more effective in reducing the population of bacteria in the long run?
Bactericide __________
Correct Answer:

Verified
Correct Answer:
Verified
Q15: Find the domain of the function.
Q16: Use the intermediate value theorem to find
Q17: A rectangular box is to have a
Q18: Use the method of bisection to find
Q19: Find the limit.<br> <img src="https://d2lvgg3v3hfg70.cloudfront.net/TB8255/.jpg" alt="Find the
Q21: Refer to the graph of the function
Q22: Entomologists have discovered that a linear relationship
Q23: In the following figure, f(t) gives the
Q24: Find the limit.<br> <img src="https://d2lvgg3v3hfg70.cloudfront.net/TB8255/.jpg" alt="Find the
Q25: Use the intermediate value theorem to find