Multiple Choice
The ratio of working-age population to the elderly in the United States (including projections after 2000) is given by 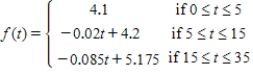
With t = 0 corresponding to the beginning of 1995. What will be the ratio at the beginning of 2005?
A) f(1995) = 35.7
B) f(10) = 4
C) f(10) = -4
D) f(10) = 4.4
E) f(1995) = -35.7
Correct Answer:

Verified
Correct Answer:
Verified
Q209: For the pair of supply and demand
Q210: At a temperature of 20°C, the volume
Q211: Use the four-step process to find the
Q212: The position of car A and car
Q213: Find the indicated limit, if it exists.
Q215: In a certain state, the sales tax
Q216: Let f be the function defined by
Q217: An apple orchard has an average yield
Q218: Find the limit.<br> <img src="https://d2lvgg3v3hfg70.cloudfront.net/TB8255/.jpg" alt="Find the
Q219: The following graph shows the ratio of