Multiple Choice
Which of the lines on the figure below is the best representation of the relationship between the volume and the number of moles of a gas, measured at constant temperature and pressure? 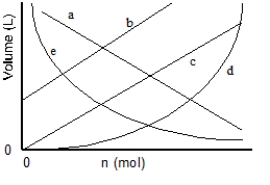
A) a
B) b
C) c
D) d
E) e
Correct Answer:

Verified
Correct Answer:
Verified
Related Questions
Q75: Which of the following gases will be
Q76: "The pressure of an ideal gas is
Q77: Hydrogen peroxide was catalytically decomposed and 75.3
Q78: If the molecular mass of a gas
Q79: A 250.0-mL sample of ammonia, NH<sub>3</sub>(g), exerts
Q81: If 0.750 L of argon at 1.50
Q82: Methane, CH<sub>4</sub>(g), reacts with steam to give
Q83: What is the pressure in a 7.50-L
Q84: What are the conditions of STP?<br>A)0 K
Q85: What is the density of carbon dioxide