Multiple Choice
The graph shows the speedometer reading of a car as it comes to a stop along a straight-line path. How far does the car move between t = 0 s and t = 16 s? 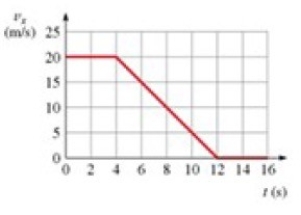
A) 130 m
B) 140 m
C) 150 m
D) 160 m
Correct Answer:

Verified
Correct Answer:
Verified
Related Questions
Q3: A car travels a distance of 140
Q4: A ball is thrown upward with a
Q5: A car travels at 50.0 km/hr for
Q6: A ball is thrown straight up with
Q7: The figure is a graph of the
Q9: A 4.0 kg mass has a velocity
Q10: Displacement is<br>A) the distance traveled from the
Q11: A sprinter runs 100.0 m in 9.87
Q12: An object starts from rest and moves
Q13: A ball is thrown downward from the