Multiple Choice
The figure shows the speedometer readings as a car comes to a stop. Solve graphically for the acceleration ax at t = 7.0 s. 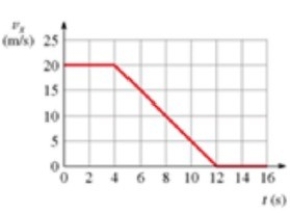
A) 2.5 m/s2
B) − 2.5 m/s2
C) − 2.0 m/s2
D) 2.0 m/s2
Correct Answer:

Verified
Correct Answer:
Verified
Related Questions
Q23: A car starts from rest and travels
Q24: A ball is thrown straight up, reaches
Q25: If an object is located 20 m
Q26: A car starts from rest and travels
Q27: A runner runs 10 m from the
Q29: An object starts from rest and travels
Q30: A boat is traveling at 4.0 m/s
Q31: A rock is thrown straight up and
Q32: One stone is dropped from the side
Q33: The figure is a graph of an