Multiple Choice
The figure shows the graph of vx versus time for an object moving along the x-axis. What is the acceleration ax at t = 7.0 s? 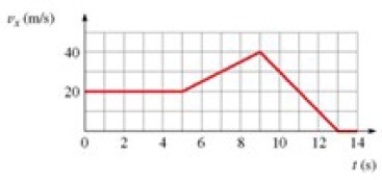
A) 4.0 m/s2
B) 5.0 m/s2
C) 0.5 m/s2
D) 0.4 m/s2
Correct Answer:

Verified
Correct Answer:
Verified
Related Questions
Q50: A 4.0 kg mass has a velocity
Q51: A model rocket flies straight upward with
Q52: A runner runs 10 m from the
Q53: The figure is a graph of v<sub>x</sub>(t)
Q54: Ball A is dropped from the top
Q56: A mouse is running away from a
Q57: A boat is traveling at 4.0 m/s
Q58: A sprinter runs 100.0 m. If he
Q59: A walker starts at the origin at
Q60: A runner runs 10 m from the