Multiple Choice
The figure shows the graph of vx versus time for an object moving along the x-axis. Solve graphically for the average acceleration between t = 5.0 s and t = 9.0 s. 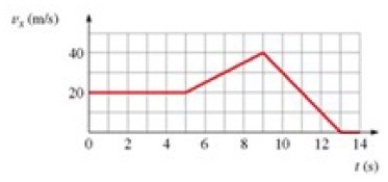
A) 4.0 m/s2
B) 5.0 m/s2
C) 0.5 m/s2
D) 0.4 m/s2
Correct Answer:

Verified
Correct Answer:
Verified
Related Questions
Q14: If an object is located 20 m
Q15: A car traveling at 4.0 m/s has
Q16: A car traveling at 3.0 m/s has
Q17: A boat is traveling at 4.0 m/s
Q18: The graph shows v<sub>x </sub>versus t for
Q20: A baseball is pitched, reaching the batter
Q21: A walker walks 30 m from the
Q22: The graph shows v<sub>x</sub> versus t for
Q23: A car starts from rest and travels
Q24: A ball is thrown straight up, reaches