Multiple Choice
Graph 22-5
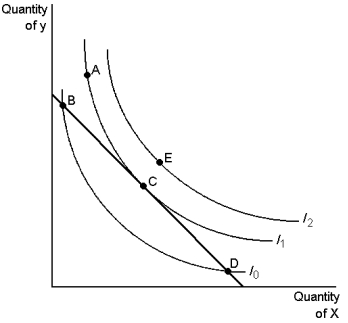
-Refer to Graph 22-5. In the figure shown, an optimising consumer is most likely to select the consumption bundle associated with:
A) point A
B) point B
C) point C
D) point E
Correct Answer:

Verified
Correct Answer:
Verified
Related Questions
Q5: A consumer who chooses to consume at
Q7: An increase in income will cause the
Q29: The budget constraints shows the different possible
Q38: Frida and Brent, two economists working on
Q50: With respect to the utility of the
Q79: Graph 22-6<br> <img src="https://d2lvgg3v3hfg70.cloudfront.net/TB8324/.jpg" alt="Graph 22-6
Q106: If the marginal rate of substitution of
Q139: Draw a budget constraint that is consistent
Q146: Bundles of goods on a consumer's indifference
Q150: A Giffen good is a good for