Multiple Choice
Graph 22-6
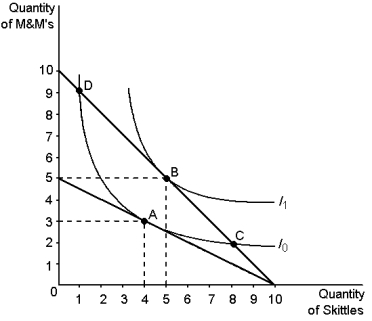
-Refer to Graph 22-6. Assume that the consumer depicted in the graph has an income of $20. The price of Skittles is $2 and the price of M&Ms is $2. This consumer will choose to optimise by consuming:
A) bundle A
B) bundle B
C) bundle C
D) bundle D
Correct Answer:

Verified
Correct Answer:
Verified
Q2: The substitution effect is the change in
Q10: Graph 22-1 <img src="https://d2lvgg3v3hfg70.cloudfront.net/TB8859/.jpg" alt="Graph 22-1
Q57: Graph 22-3 <img src="https://d2lvgg3v3hfg70.cloudfront.net/TB8859/.jpg" alt="Graph 22-3
Q91: Use a diagram to demonstrate the circumstances
Q104: A budget constraint:<br>A)represents the bundles of consumption
Q109: Graph 22-3 <img src="https://d2lvgg3v3hfg70.cloudfront.net/TB8859/.jpg" alt="Graph 22-3
Q119: The substitution effect from an increase in
Q125: A person consumes two goods: Coke and
Q142: Suppose Amy normally buys sushi and miso.There
Q147: The amount of a good that an