Multiple Choice
The figure shows a molecular-level representation of the following voltaic cell: Fe(s) + Ni2+(aq) → Fe2+(aq) + Ni(s) When drawing the "after" representation one would note that 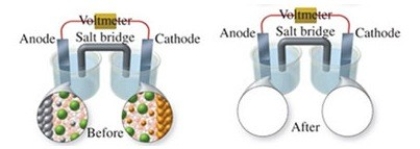
A) the nickel electrode will be smaller.
B) the iron electrode will be larger.
C) the number of Ni2+ ions in solution will decrease.
D) deposits will form in the salt bridge.
E) the number of Fe2+ ions in solution will remain constant.
Correct Answer:

Verified
Correct Answer:
Verified
Q68: Consider the reaction: Sn<sup>2+</sup>(aq)+ 2Fe<sup>3+</sup>(aq)→ Sn<sup>4+</sup>(aq)+ 2Fe<sup>2+</sup>(aq)Which
Q69: Consider the reaction: H<sub>2</sub>O(l)+ 3SO<sub>3</sub><sup>2-</sup>(aq)+ 2MnO<sub>4</sub><sup>-</sup>(aq)→ 3SO<sub>4</sub><sup>2-</sup>(aq)+
Q70: The products of the electrolysis of molten
Q71: List the oxidation number of sulfur in
Q72: A steel utility pole (made primarily of
Q74: Consider the reaction: Sn<sup>2+</sup>(aq)+ 2Fe<sup>3+</sup>(aq)→ Sn<sup>4+</sup>(aq)+ 2Fe<sup>2+</sup>(aq)Which
Q75: Which of the following sulfur species cannot
Q76: An electrolytic cell produces electrical energy.
Q77: Given the following information about the activity
Q78: The following reaction occurs in acid solution.