Multiple Choice
TABLE 2-4
A survey was conducted to determine how people rated the quality of programming available on television. Respondents were asked to rate the overall quality from 0 (no quality at all) to 100 (extremely good quality) . The stem-and-leaf display of the data is shown below.
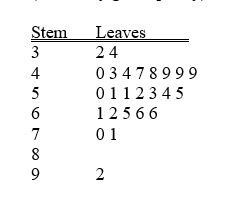
-Referring to Table 2-4, what percentage of the respondents rated overall television quality with a rating of 80 or above?
A) 0
B) 4
C) 96
D) 100
Correct Answer:

Verified
Correct Answer:
Verified
Q16: If the values of the seventh and
Q20: You have collected data on the approximate
Q92: Which of the 4 methods of data
Q147: TABLE 2-5<br>The following are the duration in
Q149: TABLE 2-8<br>The Stem-and-Leaf display represents the number
Q150: TABLE 2-13<br>Given below is the stem-and-leaf display
Q152: TABLE 2-10<br>The histogram below represents scores achieved
Q155: TABLE 2-12<br>The table below contains the opinions
Q156: TABLE 2-8<br>The Stem-and-Leaf display represents the number
Q182: A statistics student found a reference in