True/False
TABLE 2-18
The stem-and-leaf display below shows the result of a survey on 50 students on their satisfaction with their school with the higher scores represent higher level of satisfaction.
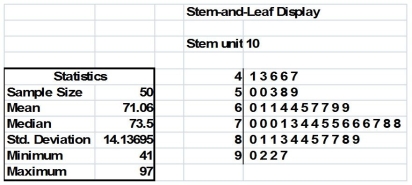
-Referring to Table 2-18, if a student is randomly selected, his/her most likely level of satisfaction will be in the 60s among the 40s, 50s, 60s, 70s, 80s and 90s.
Correct Answer:

Verified
Correct Answer:
Verified
Q19: In a contingency table,the number of rows
Q93: A_ is a vertical bar chart in
Q101: The sum of relative frequencies in a
Q140: The sum of cumulative frequencies in a
Q181: TABLE 2-5<br>The following are the duration in
Q182: TABLE 2-6<br>A sample of 200 students at
Q183: Apple Computer, Inc. collected information on the
Q184: TABLE 2-18<br>The stem-and-leaf display below shows the
Q190: TABLE 2-12<br>The table below contains the opinions
Q191: TABLE 2-13<br>Given below is the stem-and-leaf display