menu-iconExamlexExamLexServices

Discover

Ask a Question
  1. All Topics
  2. Topic
    Statistics
  3. Study Set
    Basic Business Statistics
  4. Exam
    Exam 2: Organizing and Visualizing Data
  5. Question
    Given Below Is the Scatter Plot of the Price/earnings Ratio
Solved

Given Below Is the Scatter Plot of the Price/earnings Ratio

Question 28

Question 28

True/False

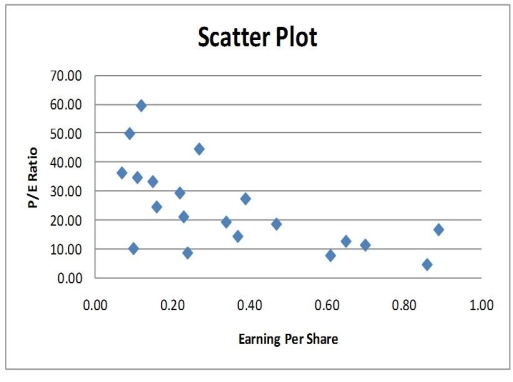
Given below is the scatter plot of the price/earnings ratio versus earnings per share of 20 U.S. companies. There appears to be a negative relationship between price/earnings ratio and earnings per share.

Correct Answer:

verifed

Verified

Unlock this answer now
Get Access to more Verified Answers free of charge

Related Questions

Q24: TABLE 2-14<br>The table below contains the number

Q27: TABLE 2-6<br>A sample of 200 students at

Q30: TABLE 2-14<br>The table below contains the number

Q31: TABLE 2-5<br>The following are the duration in

Q32: TABLE 2-5<br>The following are the duration in

Q79: You have collected information on the consumption

Q90: In constructing a polygon,each class grouping is

Q128: When constructing a frequency distribution,classes should be

Q141: Data on 1,500 students' height were collected

Q168: When comparing two or more large sets

Examlex

ExamLex

About UsContact UsPerks CenterHomeschoolingTest Prep

Work With Us

Campus RepresentativeInfluencers

Links

FaqPricingChrome Extension

Download The App

Get App StoreGet Google Play

Policies

Privacy PolicyTerms of ServiceHonor CodeCommunity Guidelines

Scan To Download

qr-code

Copyright © (2025) ExamLex LLC.

Privacy PolicyTerms Of ServiceHonor CodeCommunity Guidelines