menu-iconExamlexExamLexServices

Discover

Ask a Question
  1. All Topics
  2. Topic
    Statistics
  3. Study Set
    Basic Business Statistics
  4. Exam
    Exam 2: Organizing and Visualizing Data
  5. Question
    Given Below Is the Scatter Plot of the Price/earnings Ratio
Solved

Given Below Is the Scatter Plot of the Price/earnings Ratio

Question 178

Question 178

True/False

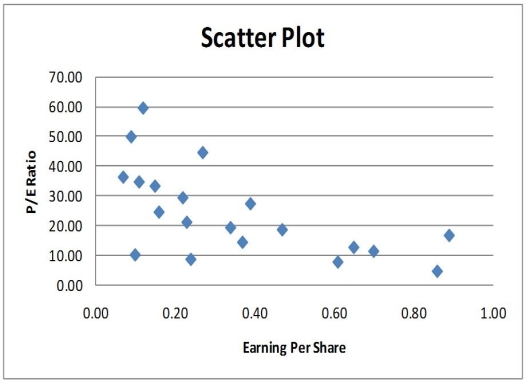
Given below is the scatter plot of the price/earnings ratio versus earnings per share of 20 U.S. companies. There appear to be a positive relationship between price/earnings ratio and earnings per share.

Correct Answer:

verifed

Verified

Unlock this answer now
Get Access to more Verified Answers free of charge

Related Questions

Q129: The width of each class grouping or

Q173: TABLE 2-14<br>The table below contains the number

Q174: A Wal-Mart store in a small town

Q175: TABLE 2-8<br>The Stem-and-Leaf display represents the number

Q176: TABLE 2-17<br>The following table presents total retail

Q179: Given below is the scatter plot of

Q180: TABLE 2-6<br>A sample of 200 students at

Q181: TABLE 2-5<br>The following are the duration in

Q182: TABLE 2-6<br>A sample of 200 students at

Q183: Apple Computer, Inc. collected information on the

Examlex

ExamLex

About UsContact UsPerks CenterHomeschoolingTest Prep

Work With Us

Campus RepresentativeInfluencers

Links

FaqPricingChrome Extension

Download The App

Get App StoreGet Google Play

Policies

Privacy PolicyTerms of ServiceHonor CodeCommunity Guidelines

Scan To Download

qr-code

Copyright © (2025) ExamLex LLC.

Privacy PolicyTerms Of ServiceHonor CodeCommunity Guidelines