Short Answer
TABLE 3-8
The time period from 2006 to 2009 saw a great deal of volatility in the value of stocks. The data in the following table represent the total rate of return of our companies from 2006 to 2009.
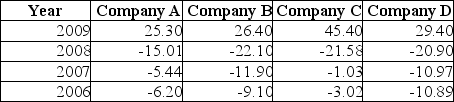
-Referring to Table 3-8, calculate the geometric mean rate of return per year for Company A.
Correct Answer:

Verified
Correct Answer:
Verified
Q6: TABLE 3-1<br>Health care issues are receiving much
Q9: TABLE 3-2<br>The data below represent the amount
Q10: TABLE 3-4<br>The ordered array below represents the
Q12: TABLE 3-5<br>The rates of return of a
Q14: TABLE 3-5<br>The rates of return of a
Q16: TABLE 3-3<br>The ordered array below represents the
Q18: Which of the arithmetic mean,median,mode,and geometric mean
Q109: The geometric mean is a measure of
Q116: The Z scores can be used to
Q129: The coefficient of variation is expressed as