Short Answer
TABLE 3-8
The time period from 2006 to 2009 saw a great deal of volatility in the value of stocks. The data in the following table represent the total rate of return of our companies from 2006 to 2009.
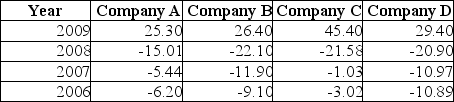
-Referring to Table 3-8, calculate the geometric mean rate of return per year for Company C.
Correct Answer:

Verified
Correct Answer:
Verified
Q9: A boxplot is a graphical representation of
Q43: In exploratory data analysis,a boxplot can be
Q73: TABLE 3-12<br>Given below are the rating and
Q74: TABLE 3-4<br>The ordered array below represents the
Q75: Which of the following statements about the
Q76: TABLE 3-3<br>The ordered array below represents the
Q78: TABLE 3-7<br>In a recent academic year, many
Q79: In a set of numerical data, the
Q81: If the distribution of a data set
Q119: The geometric mean is useful in measuring