Short Answer
TABLE 3-8
The time period from 2006 to 2009 saw a great deal of volatility in the value of stocks. The data in the following table represent the total rate of return of our companies from 2006 to 2009.
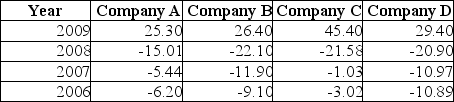
-Referring to Table 3-8, calculate the geometric mean rate of return per year for Company D.
Correct Answer:

Verified
Correct Answer:
Verified
Q43: You were told that the 1ˢᵗ, 2ⁿᵈ
Q44: TABLE 3-7<br>In a recent academic year, many
Q45: TABLE 3-6<br>The rates of return of an
Q49: The five-number summary consists of the smallest
Q49: TABLE 3-2<br>The data below represent the amount
Q50: TABLE 3-2<br>The data below represent the amount
Q51: TABLE 3-2<br>The data below represent the amount
Q73: If a set of data is perfectly
Q78: A population with 200 elements has an
Q132: Which of the following is the easiest