Multiple Choice
TABLE 10-9
The following Excel output contains the results of a test to determine whether the proportions of satisfied customers at two resorts are the same or different.
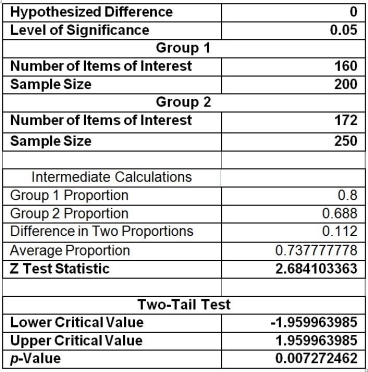
-Referring to Table 10-9, allowing for 1% probability of committing a Type I error, what are the decision and conclusion on testing whether there is any difference in the proportions of satisfied customers in the two resorts?
A) Do not reject the null hypothesis; there is enough evidence to conclude that there is significant difference in the proportions of satisfied guests at the two resorts.
B) Do not reject the null hypothesis; there is not enough evidence to conclude that there is significant difference in the proportions of satisfied guests at the two resorts.
C) Reject the null hypothesis; there is enough evidence to conclude that there is significant difference in the proportions of satisfied guests at the two resorts.
D) Reject the null hypothesis; there is not enough evidence to conclude that there is significant difference in the proportions of satisfied guests at the two resorts.
Correct Answer:

Verified
Correct Answer:
Verified
Q6: The Wall Street Journal recently ran an
Q22: The Wall Street Journal recently published an
Q24: TABLE 10-15<br>The table below presents the summary
Q25: TABLE 10-10<br>A corporation randomly selects 150 salespeople
Q26: TABLE 10-5<br>To test the effectiveness of a
Q28: TABLE 10-6<br>To investigate the efficacy of a
Q29: TABLE 10-6<br>To investigate the efficacy of a
Q31: TABLE 10-12<br>A quality control engineer is in
Q32: TABLE 10-4<br>Two samples each of size 25
Q99: The sample size in each independent sample