Short Answer
TABLE 10-9
The following Excel output contains the results of a test to determine whether the proportions of satisfied customers at two resorts are the same or different.
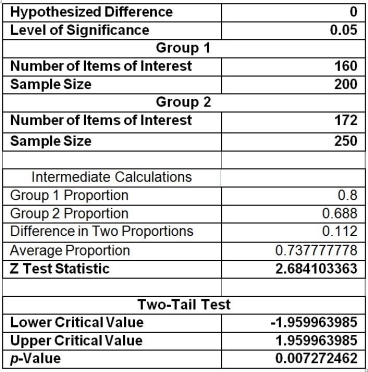
-Referring to Table 10-9, construct a 95% confidence interval estimate of the difference in the population proportion of satisfied guests between the two resorts.
Correct Answer:

Verified
Correct Answer:
Verified
Q92: When you test for differences between the
Q130: TABLE 10-4<br>Two samples each of size 25
Q131: TABLE 10-4<br>Two samples each of size 25
Q133: TABLE 10-8<br>A few years ago, Pepsi invited
Q134: TABLE 10-10<br>A corporation randomly selects 150 salespeople
Q136: TABLE 10-6<br>To investigate the efficacy of a
Q137: In testing for differences between the means
Q138: If we are testing for the difference
Q139: TABLE 10-7<br>A buyer for a manufacturing plant
Q140: TABLE 10-8<br>A few years ago, Pepsi invited