Multiple Choice
TABLE 13-2
A candy bar manufacturer is interested in trying to estimate how sales are influenced by the price of their product. To do this, the company randomly chooses 6 small cities and offers the candy bar at different prices. Using candy bar sales as the dependent variable, the company will conduct a simple linear regression on the data below: 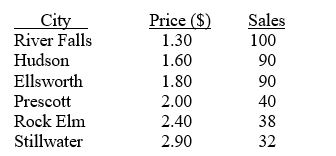
-Referring to Table 13-2, what is the estimated mean change in the sales of the candy bar if price goes up by $1.00?
A) 161.386
B) 0.784
C) -3.810
D) -48.193
Correct Answer:

Verified
Correct Answer:
Verified
Q69: The coefficient of determination represents the ratio
Q79: If the Durbin-Watson statistic has a value
Q86: TABLE 13-12<br>The manager of the purchasing department
Q88: TABLE 13-10<br>The management of a chain electronic
Q89: TABLE 13-10<br>The management of a chain electronic
Q90: Referring to Table 13-2, to test whether
Q90: In performing a regression analysis involving two
Q94: TABLE 13-13<br>In this era of tough economic
Q95: TABLE 13-13<br>In this era of tough economic
Q194: You give a pre-employment examination to your